Advertisement
14,360
pages
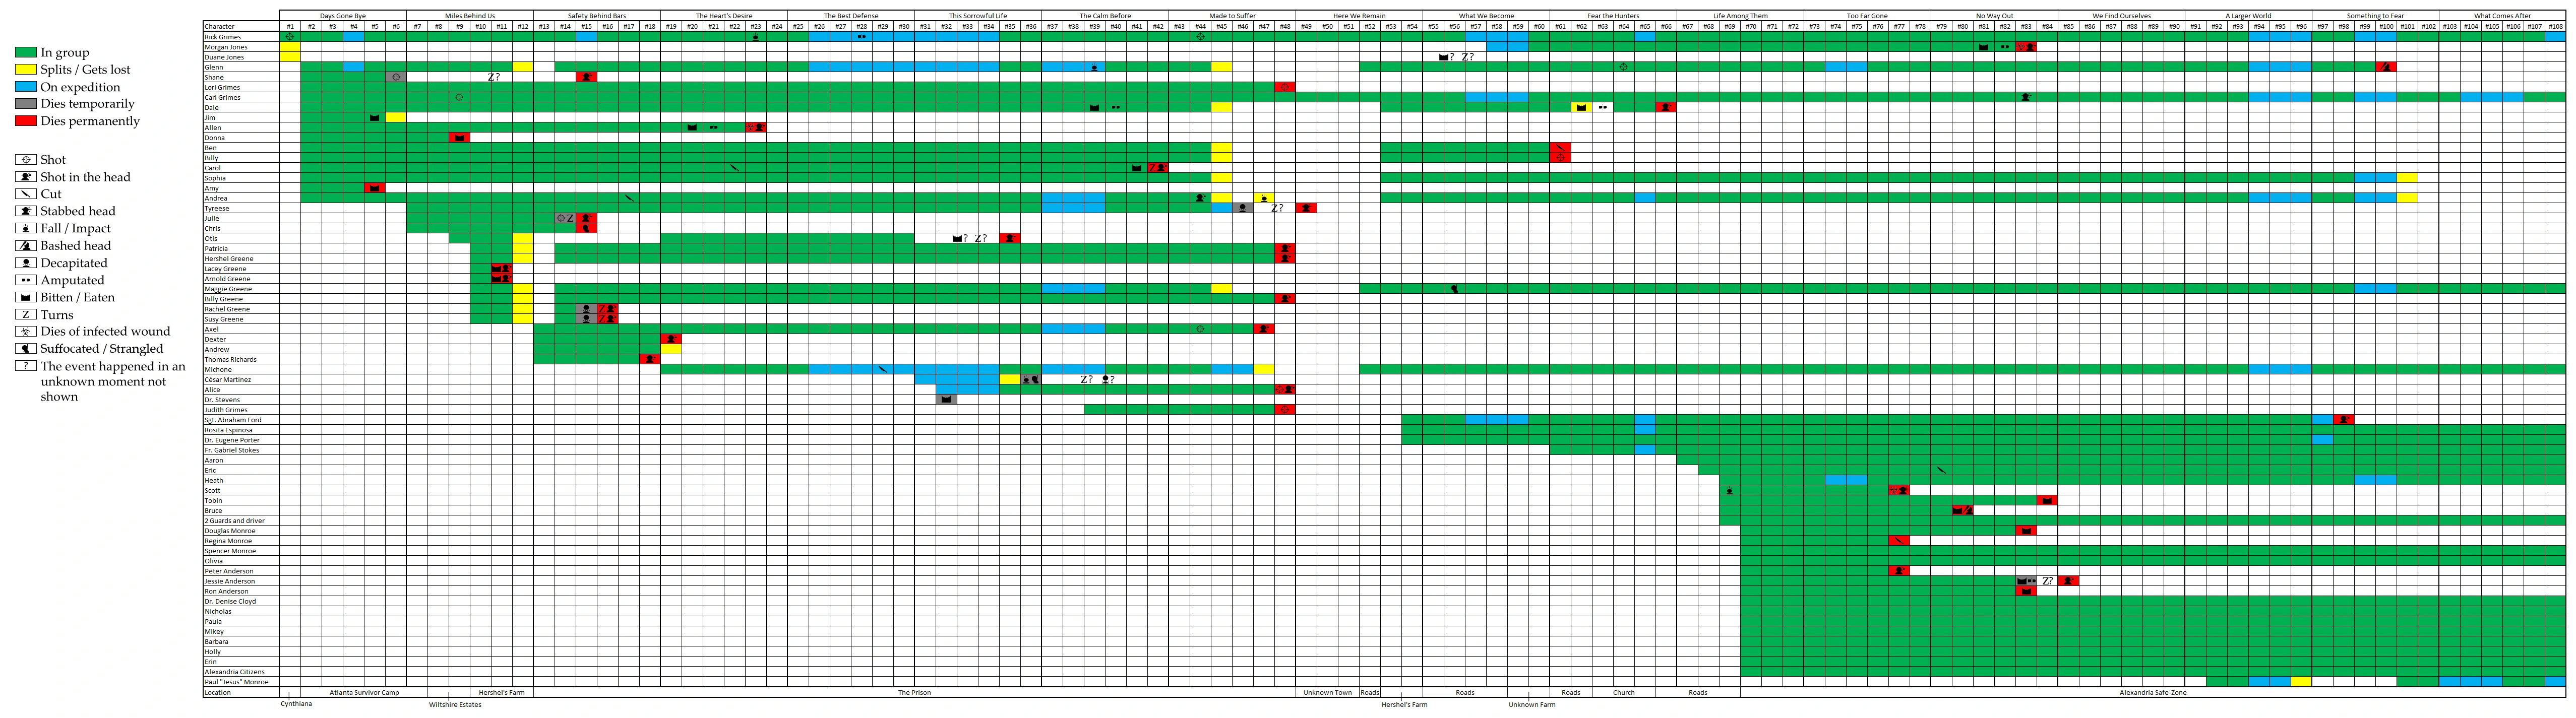
Comic Series Issues Graph

Advertisement
Attention! Please be aware that spoilers are not allowed on the wiki and a violation of this policy may result in a ban. Information (character deaths/fates, screenshots, etc.) from episodes released early on AMC+ may not be added to the wiki until the episode officially airs at 9pm EST on the Sunday it is scheduled for. Thank you.
READ MORE